| All
measurements took place outdoors, near GSM base stations (50-250m distance),
that can be freely accessible by the general population (e.g. roads,
playgrounds, schools, squares, or the vicinity of public buildings).
The measurement points were chosen in such a way that they are distributed
along the whole urban area of Thessaloniki. In the
municipalities of the rest north Greece, the measurement places
were selected, in order to be near to places
of public access and interest (schools,
squares, central streets, e.t.c.).
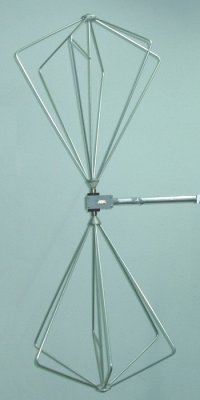
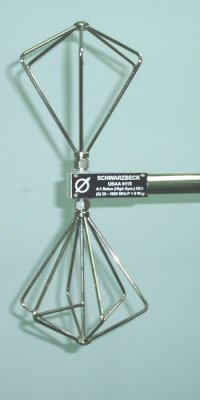
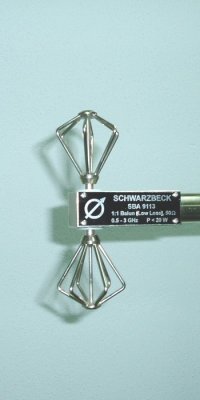
The
frequency range which was measured in the present study (20-3000MHz)
was divided in a number of frequency bands. An appropriate antenna was
used for each band.
The antennas were calibrated for the frequency range for which they
were used. The measuring antenna was placed at a height between 1.9
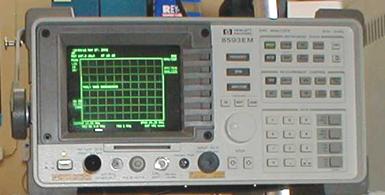
and 2.2 meters above the ground. Each of the three frequency ranges which were measured
with a specific antenna type, was divided into subbands. The spectrum
analyzer was appropriately initialized, in order to guarantee:
-
sufficient distinction between the
signals of each subband
-
accuracy in the estimation of the total power density, by choosing an intermediate
frequency filter proportional to the expected frequency range of
the measured source, where possible, and
-
measurement time that allows completing a measurement
of the total frequency range within an acceptable time.
The estimation of the
power density and the
corresponding
SI in each frequency subband (e.g. FM, GSM) is made by processing
spectra that are received with different intermediate filters. The
identification and the detection of the peak values (of the emissions)
is made in the spectrum recording taken with the narrowest intermediate
filter. On the other hand, the estimation of the final value is made
with the values taken with a wide intermediate filter, in order to
overestimate the power corresponding to each discrete peak (emission
frequency). By using a software of automated measurement, there
is the possibility to divide each frequency range into subbands, in
order to achieve a detailed scan. Each frequency subrange can be scanned
up to 50 times.The data are transfered and saved in the computer's hard
disk, for further processing.
It is worth noting that the temperature and humidity
at the measurement points were not recorded. |