|
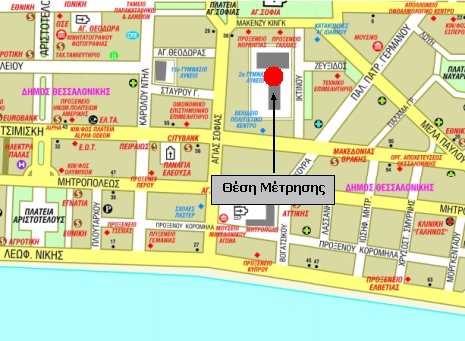
TIME AND PLACE | |||||||||||||||||
 |
 |
||||||||||||||||
|
|
||||||||||||||||
|
home page |
brief description |
exposure guidelines |
legal frame |
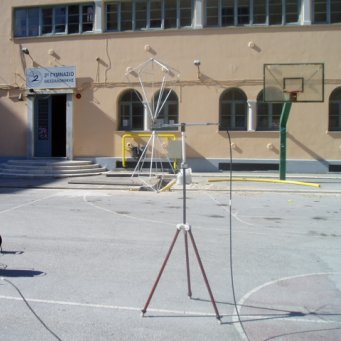
equipment and measurement procedures |
measurement results |
|
TIME AND PLACE | |||||||||||||||||
|
|
|
||||||||||||||||
|
|
||||||||||||||||
| RESULTS |
|
|
|
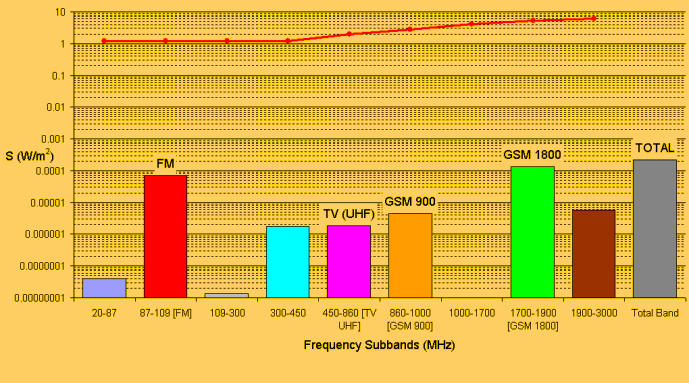 |
The bar graph on the left depicts the estimated power density for each subband of the controlled spectrum. The red line denotes the reference level in the central frequency of each subband, according to the Greek law. |
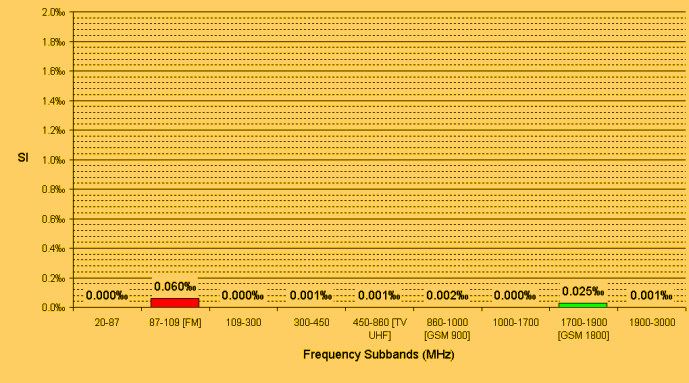 |
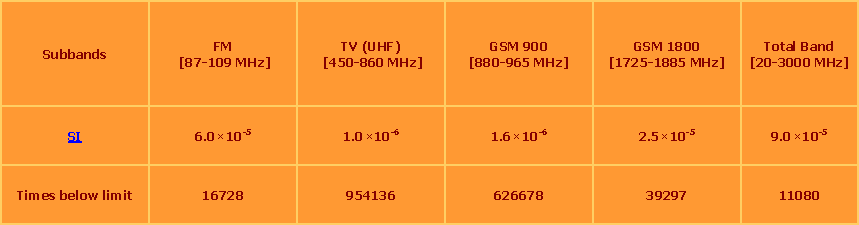
The figure on the left presents the percentage of the SI in each subband estimated with relation to the established limit for thermal effect circumstances. |
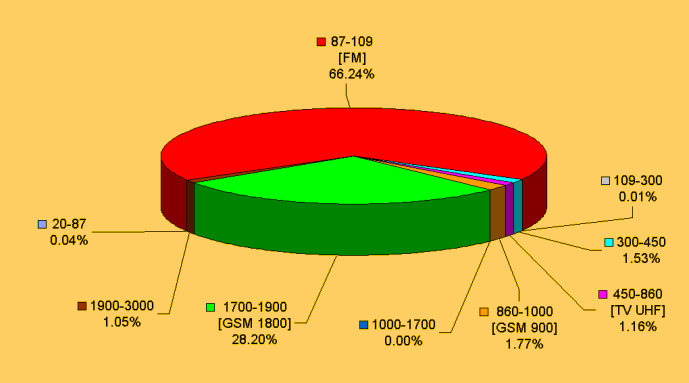 |
The adjacent figure presents the contribution of each spectral subband in the total exposure quotient (SI). By following the links below for each subband, one can see the ten frequencies with the greatest measured power: FM, TV (UHF), GSM 900 and GSM 1800. |